
![]()
This guide is designed to be simple and concise, so below are the highest probability set ups that nearly all profitable traders use every day to make billions in profits, and now I will show you those indicators. You will see how to spot them, and how to confirm they are valid using confluence.
 1. The pin hammer
The first high probability set up I’ll be showing you is called the pin hammer, it’s ridiculously easy to spot and provides the highest probability reversal signal in Forex. Period. If you follow the info on this page, it can be up to 80% accurate! The pin hammer has 2 elements to consider when assessing its validity. It’s characteristics and it’s location on the chart. First I’ll be teaching you how to easily spot the characteristics.
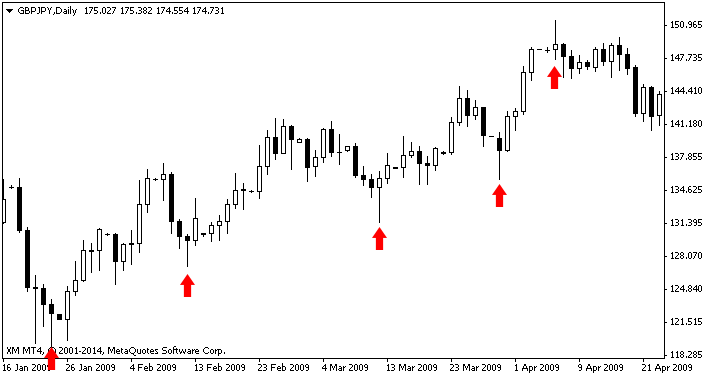
[Solid up trend with pin hammer entry signals, you would aim to buy on every touch and sell on the end reversal pin]
Above you can see 4 bull pin hammers, and one bear pin hammer at the top. A bull hammer can signal a rise in price, and a bear hammer can signal a drop in price.
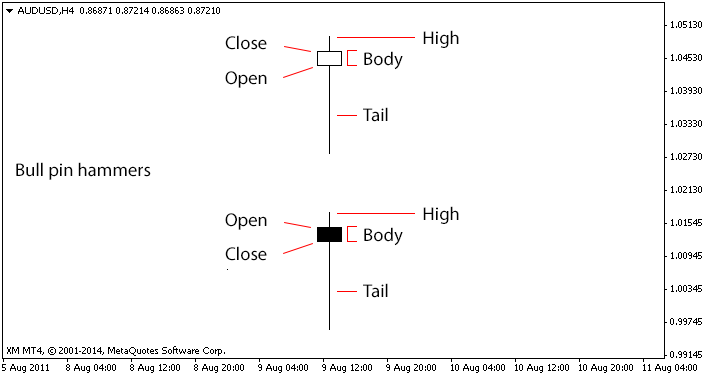
[Bull pin hammers are buying signals]
Above are two sorts of bull pin hammer, hollow and solid. The solid variation carries a slightly higher probability of being valid due to the bulls being able to close the price higher than the open, winning the day. However they are both very strong signals when used with confluence.
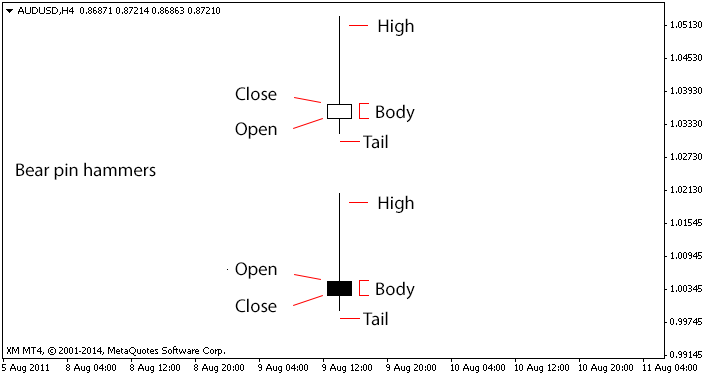
[Bear pin hammers are selling signals]
![]()
This is the same for bear pin hammers above, just in reverse. The bears won the day, and managed to close the price lower than it opened. Please note that some traders and brokers have their candles colored differently, and sometimes opposite to shown here.
Note: There is no standard colours or fill for candle sticks. I’ll show the broker we use at the end of this article so everything is the same when you come to trade.
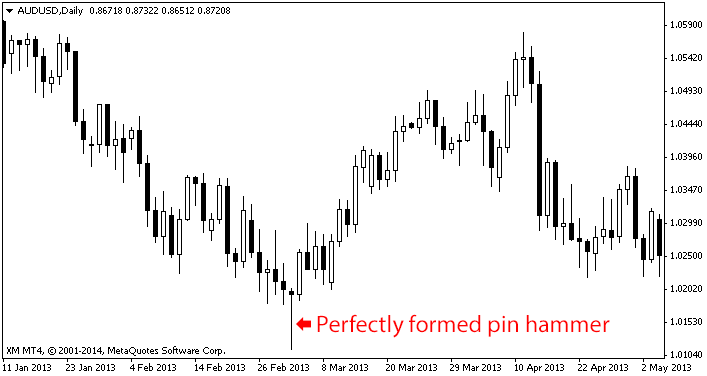
[Bull pin hammer reversal signal with perfect definition]
Pin hammer formation tips
- 1. The shorter the high, the higher the probability of a successful trade,
- 2. The longer the tail, the higher the probability of a successful trade
- 3. The tail should be at least twice the length of the body, three times the length is even better
- Reverse the above three tips for bear hammers
- 4. The less distance between the open and close of the body, the better
- 5. You must absolutely establish confluence to make any trade using these set ups. Explained shortly.
Pin hammer location
These patterns are absolutely no good unless they occur at key points on the chart. The location of the bars needs to be at the end of a momentum.
Further, pin hammers that occur at a point that doesn’t match any trend or support level are not to be considered a high probability trading signal and should be left alone. This ‘confluence’ will be explained in just a moment.
Pin bars are reversal signals, that means if the currency price is going down, you see a pin bar at the bottom of the price trace, it hits the trend or support level and will then bounce off the level, reverse direction at which point you buy, and there is a very high chance the stock will start increasing in price.
It’s works in the opposite direction as well, if a stock is going up and it hits a key trend or resistance level, the stock is very likely to bounce down from the ceiling at which point you short (sell) the stock.
The pin bar should be seen as the very end of a recent movement, the stock has been pushed so far in one direction, that it reaches the absolute limit of travel like a spring, then springs back and sets the direction of travel for the next swing in price. It needs to be a strong rejection of price, the tail of the pin should reach out far beyond any recent movement.
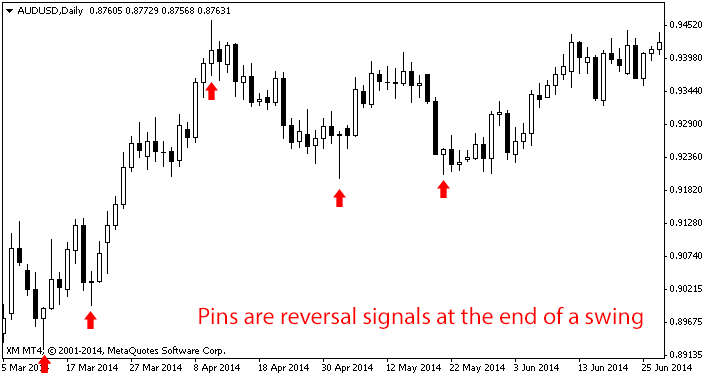
[Pin hammer reversal signals are up to 80% accurate]
Confluence – Confirming your suspicions.
Confluence is defined as a secondary indicator that gives credence to your trade. This is in the form of trend lines, or support or resistance levels.
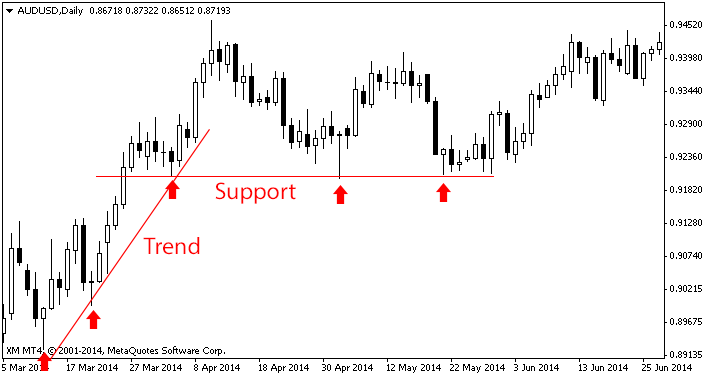
[Pin hammer signals with support and trend lines with drawn]
Above we see the horizontal as a support line. You can see at every point it’s touched a pin hammer is formed. We can use this as a swing to trade from. Every time the level is touched with a pin hammer, we can trade in the opposite direction with a set limit to reach before exiting the trade.
You can also see the diagonal is a up trend line. A trend is simply a upward or downward movement. An up trend is a higher low, followed by a higher low. A down trend is a lower high, followed by a lower high. You can also see every time the trend is touched a pin hammer is formed. We can either swing trade from these ‘bounces’ of the line. Or use the trend to stay in the trade, and use the trend line to signal the exit point. Once the currency or stock moves down past the trend line and ‘breaks’ it with reasonable breathing room, we can consider the trend broken and exit the trade.
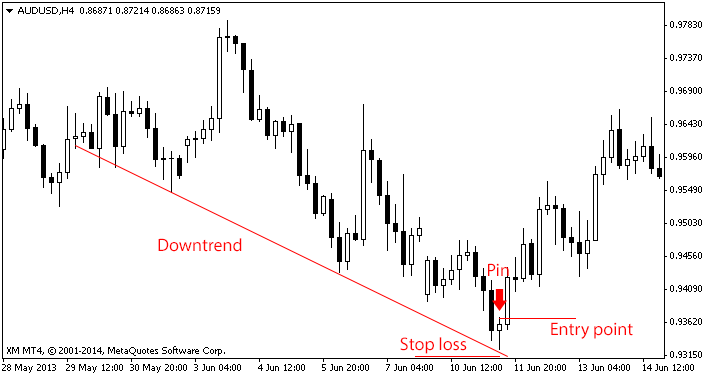
[Down trend with pin hammer entry signal]
Above is a very simple downward trend. It’s confirmed with 3 touches, and then a pin hammer is formed on the 4th touch signaling a reversal upwards. There is also a pin hammer on the 2nd touch but the trend is not clear at that point. It’s better to wait for absolute confirmation, remember you want to only trade surefire winners.
A famous Wall street trader would identify trends by printing the chart out, standing at the other side of the room and squinting his eyes!
Here are some more examples of trends bellow.
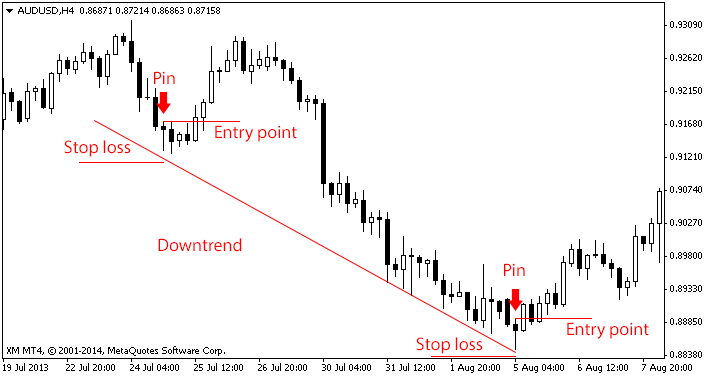
[Downtrend with two possible entry points, can you tell which one is no good and why?]
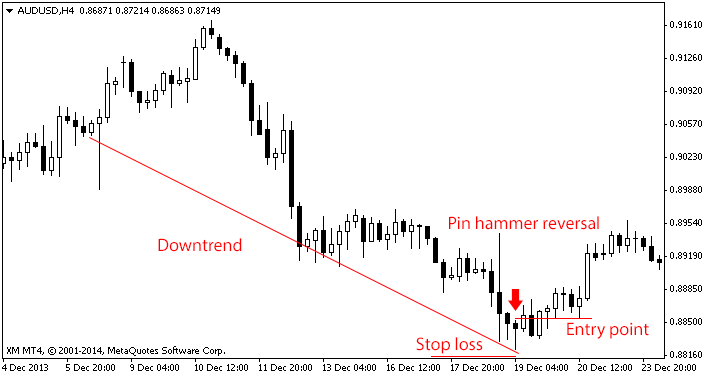
[Pin hammer formed on the 2nd trend line touch for maximum confluence]
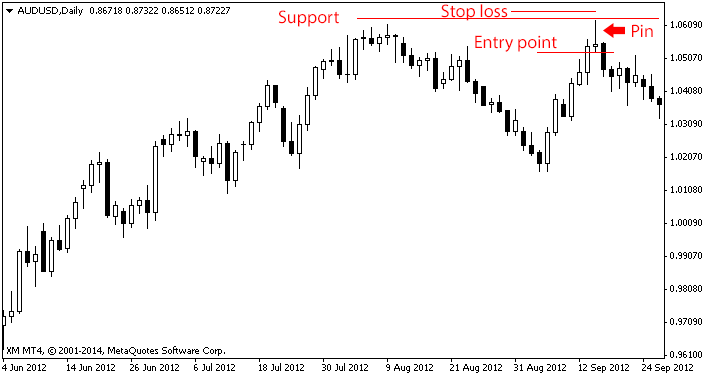
[Example of a bear pin hammer, backed up with resistance confluence.]
Below you have 2 channels forming, the key price acts as both support and resistance. Once the support level is broken, it transmutes in resistance. This is very common, traders remember a certain prices being either painful or rewarding, and once that psychological barrier is broken trader reviews their outlook on that price and resistance becomes support or visa versa. It’s a great idea to look out for these channels, you can often trade the swings in between each one once a pin hammer is formed. The type of hammer and it’s location will show you which way to trade. A bear hammer at the top of the channel (resistance) and bull hammer at the bottom (support).
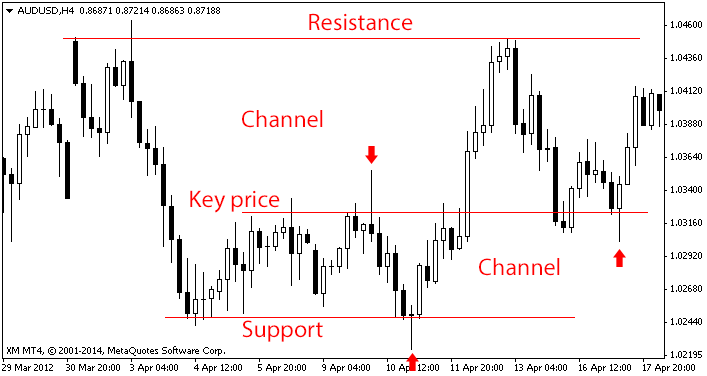
[Support & resistance channels.]
How simple are those to spot? Easy right. No genius maths equations here, just simple set ups that represent the strongest rejections of price that can’t be manipulated by the ‘big powers’. Now that’s not all, so don’t run off just yet and dive straight in. I said before spotting the set ups was easy. The key to actual profits is being able to trade these set ups profitably, and I’ll be showing you how in just a moment.
If you haven’t already signed up to the mailing list, do it now and get two more high probability set ups + live trade set ups as they happen.
You will see a lot of fake pin hammers that easily fool newbie traders that occur during a range period. But once you understand what the pin represents (the absolute market limit of a recent price movement, and strong rejection at that price) they hit you like a slap in the face. If they occur at a confluence point, then it’s time to plan your trade.
It’s really that simple! Find a pin hammer, does it occur at at a key point in a trend? Or at support or resistance levels? Is it perfectly formed? If yes the trade has a high probability of reversing and you can enter the trade in the opposite direction of recent travel with confidence.
When to enter and exit the trade?
Stop losses. You will want to set your stop loss under the trend or support level or above the resistance level (confluence). A great tip is to allow some breathing room for your stop loss. Your confluence points will never be 100% on the mark, and it’s better to give your self a few points error than to get stopped out of a perfectly good trade. How much is up to you and will come from experience and your level of risk reward.
I will show you how to set up your stop losses from a technical point of view shortly. A stop loss is a price point your trading platform will automatically close the trade for you to stop you losing more than you need to, and is essential for risk management.
Entry point: You will want to enter the trade using the pin hammer signal once it’s confined by a trend, support or resistance line. A third and final measure is to only enter a bull pin once one of the next 1-3 candles starts trading above the high (wick) of the pin hammer and reverse for bear hammers. This way you can ensure the reversal is actually happening. It might happen right away on the next candle so you can place a limit order, to automatically open your position once the price is greater than the high of the pin for hands free trading.
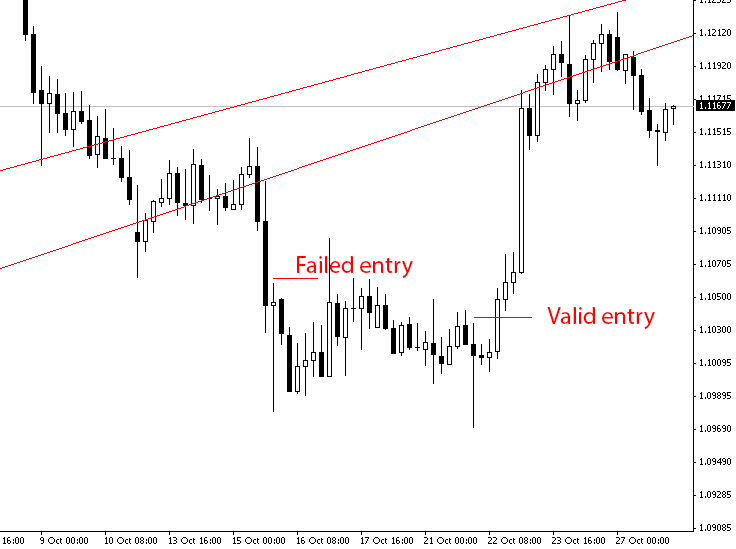
[The first entry fails because the next 3 candles don’t ever trade above the high of the pin hammer. The second pin hammer trades above the high on the 3rd candle so we can enter with confidence]
Exit: I will cover risk management in full in just a moment, this will show you exactly how much you can risk for your potential gain. It comes down to many factors, and will separate you from the 90% of losing traders. A recent study of every client on a popular trading platform showed that even though 90% of traders lost money, over 59% of them were right about their trades. This seems like a crazy statement, but it’s all about risk management. You see even though they were right 59% of the time, the average gain was only 60 pips, while the average loss was 140 pips. Unless you get this part right, you will lose money. So hold tight and I’ll uncover some industry secrets to keep you in the black.
What next?
I remember being driven mad when I first started just trying to find a good trading platform! Some were absolutely shockingly bad. I must have gone though the hassle of setting up accounts with 4 providers before I found a decent one, and since then I have moved at least twice. The problem is some providers have little traffic and they group their trades together, so you can sometimes have to wait considerable time to have your trade executed, and then not at the price you wanted as they re-quote it. This is a real pain.
The other problem is the time it takes to actually have your account set up, the industry is highly regulated and all providers have to manually approve your account after your submit ID. One provider I used took 4 days to process the ID, you will find this very frustrating.
All of this pales in comparison to actually signing up with a scam broker, this does happen and people do lose serious money. I would hate to see any of this happen to you, so I urge you to hijack the time and mistakes I have already made, and use one of our approved brokers.
Take a look at the recommended brokers here.